
Carpet Diem Cleaning was spending on Google Ads with no reliable tracking behind it. We rebuilt the tracking foundation, took over the account, and started counting every lead type separately.
All figures from the client’s Google Ads account. No numbers estimated or rounded up.
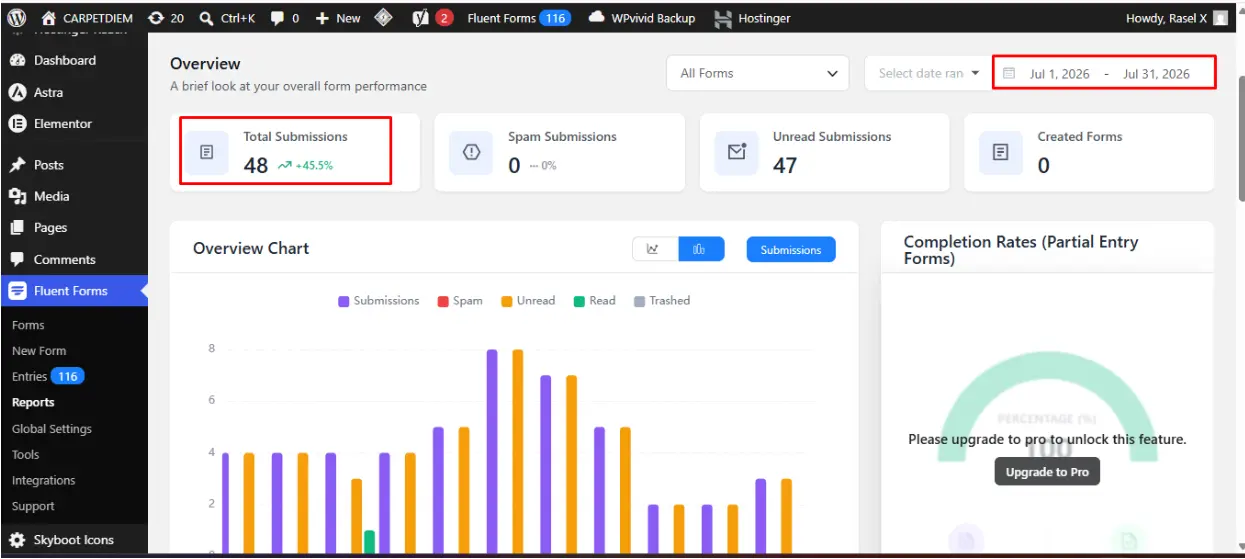

Before this engagement, Carpet Diem Cleaning had no reliable tracking in place — Google Ads was spending money, but there was no accurate, trustworthy data behind it.
Three pieces of work, in this order, starting May 9, 2026.
GA4, Google Ads conversion tracking and Google Analytics — now 100% accurate and properly connected for marketing decisions.
Campaign structure, budgets, bidding and ad copy moved under our management from day one of the engagement.
Form submissions, WhatsApp messages and phone calls each counted as their own conversion — not one vague number.
Because the before and after windows are different lengths (86 days vs. 25 days), the fairest comparison is conversions-per-day: roughly a 17× increase in daily conversion rate, alongside an 86% drop in cost per conversion — about 7× cheaper per lead.
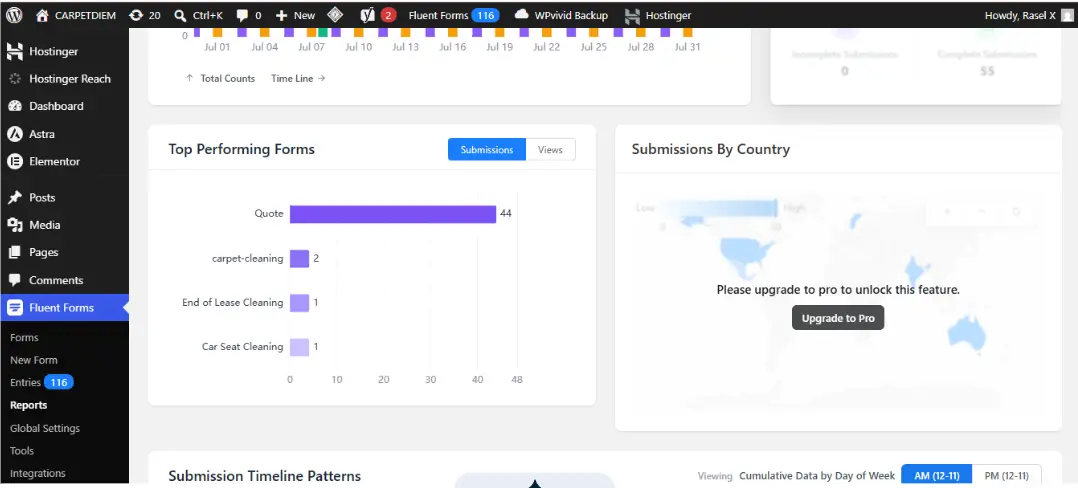
Source: the client’s Google Ads account, reporting window May 9 – Jun 2, 2026.
Before this engagement, Carpet Diem Cleaning was paying $193 for every lead, with no accurate tracking to explain why. After rebuilding the tracking foundation and taking over campaign management, the cost per lead dropped to $27 — and leads started coming in through three trackable channels instead of one unreliable number.
Note: all figures above come directly from the client’s Google Ads account data and the shared reporting sheet — no numbers were estimated or rounded up for effect.
We’ll look at your tracking, your ads and your current setup, then tell you where the money is leaking.